

Short answer
Current guidelines don't raise "normal" with age: the AHA/ACC calls under 120/80 normal for all adults and sets a treatment goal under 130/80 for most adults, older adults included. What rises with age is the average reading. In US survey data from 2021–2023, 23.4% of adults aged 18–39 had hypertension, compared with 52.5% at 40–59 and 71.6% at 60 and over.
The target doesn't move with age
Plenty of "normal blood pressure by age" tables online list a higher normal for each decade. Those numbers don't come from current US or European guidelines.
The AHA/ACC categories (normal under 120/80, elevated 120–129/under 80, stage 1 from 130/80, stage 2 from 140/90) apply to all adults. The 2025 AHA/ACC guideline sets one overall treatment goal of under 130/80 for all adults. It makes extra allowances for people living in care homes, people with a limited predicted lifespan and pregnant women, but not for age by itself.
Europe takes a similar line. The ESC 2024 guideline aims for a systolic of 120–129 in most people on treatment if they tolerate it, and asks for a more individual approach in frail older people. You can see the full category tables in our blood pressure chart.
What does rise with age: the average reading
Population numbers tell a different story from targets. The CDC's National Health and Nutrition Examination Survey (NHANES) measured blood pressure in a nationally representative sample of US adults between August 2021 and August 2023. Using the AHA/ACC cut-off of 130/80 (or taking blood pressure medication), here's how common hypertension was:
- Ages 18–39: 23.4%
- Ages 40–59: 52.5%
- Ages 60 and over: 71.6%
- All adults: 47.7%
Awareness climbs with age too. Only 27.2% of younger adults with hypertension knew about it, compared with 73.7% of those 60 and over. Control was low in all groups: 20.7% of adults with hypertension overall had their pressure under 130/80.
So a 70-year-old with a reading of 138/78 is typical. That doesn't make it the target. It's still stage 1 under the AHA/ACC chart.
Systolic and diastolic age differently
Long-term data comes from the Framingham Heart Study, which followed the same people for up to 30 years. Among people not taking blood pressure medication, systolic pressure rose in a steady line from age 30 to 84.
Diastolic pressure behaved differently. It rose alongside systolic until about 50 to 60, then started to fall. As the top number kept climbing and the bottom number dropped, the gap between them widened. That gap is called pulse pressure.
The researchers concluded this pattern is consistent with large arteries getting stiffer. A stiff artery can't stretch to absorb each heartbeat, so the peak pressure goes up and the pressure between beats falls away faster. The AHA lists stiffer arteries, plaque buildup and more heart and blood vessel disease as the main reasons systolic tends to rise as people get older.
Which number matters most at each age
A second Framingham analysis followed about 6,500 people for 20 years to see which number best predicted coronary heart disease at different ages.
- Under 50: diastolic was the strongest predictor
- 50–59: systolic, diastolic and pulse pressure were about equally useful
- 60 and over: pulse pressure was the strongest predictor, and a lower diastolic (with systolic held equal) was linked to higher risk
That's why a younger adult shouldn't brush off a diastolic of 88, and why an older adult with 150/65 shouldn't take comfort from the low bottom number. Our guides to systolic and diastolic pressure go deeper.
Why there's no honest "normal for 65" number
Age tables are tempting because they seem personal. The trouble is that they turn an average into a goal. If most 70-year-olds have hypertension, the average 70-year-old reading describes a population with a lot of untreated high blood pressure, not a healthy one.
Your own target depends on things an age table can't see: other conditions like diabetes or kidney disease, your overall heart risk, the medications you take and how well you tolerate a lower reading. That conversation belongs with your doctor.
Older adults: when lower isn't always better
Guidelines do bend for some older people. NICE (England) uses an age-based target: a clinic reading under 140/90 for people under 80, and under 150/90 for people 80 and over. At home the equivalents are 135/85 and 145/85. NICE also says to use clinical judgment for people with frailty or several long-term conditions.
If someone's blood pressure drops noticeably when they stand, NICE advises basing the target on the standing reading. Dizziness or near-fainting after standing, or after a new medicine, is worth reporting. The NHS treats a reading under 90/60 as low.
Tracking readings over the years
Because blood pressure drifts slowly with age, the useful question isn't "what's normal for my age?" but "how is my average changing?" A few readings a week, logged the same way, will show that far better than any single check.
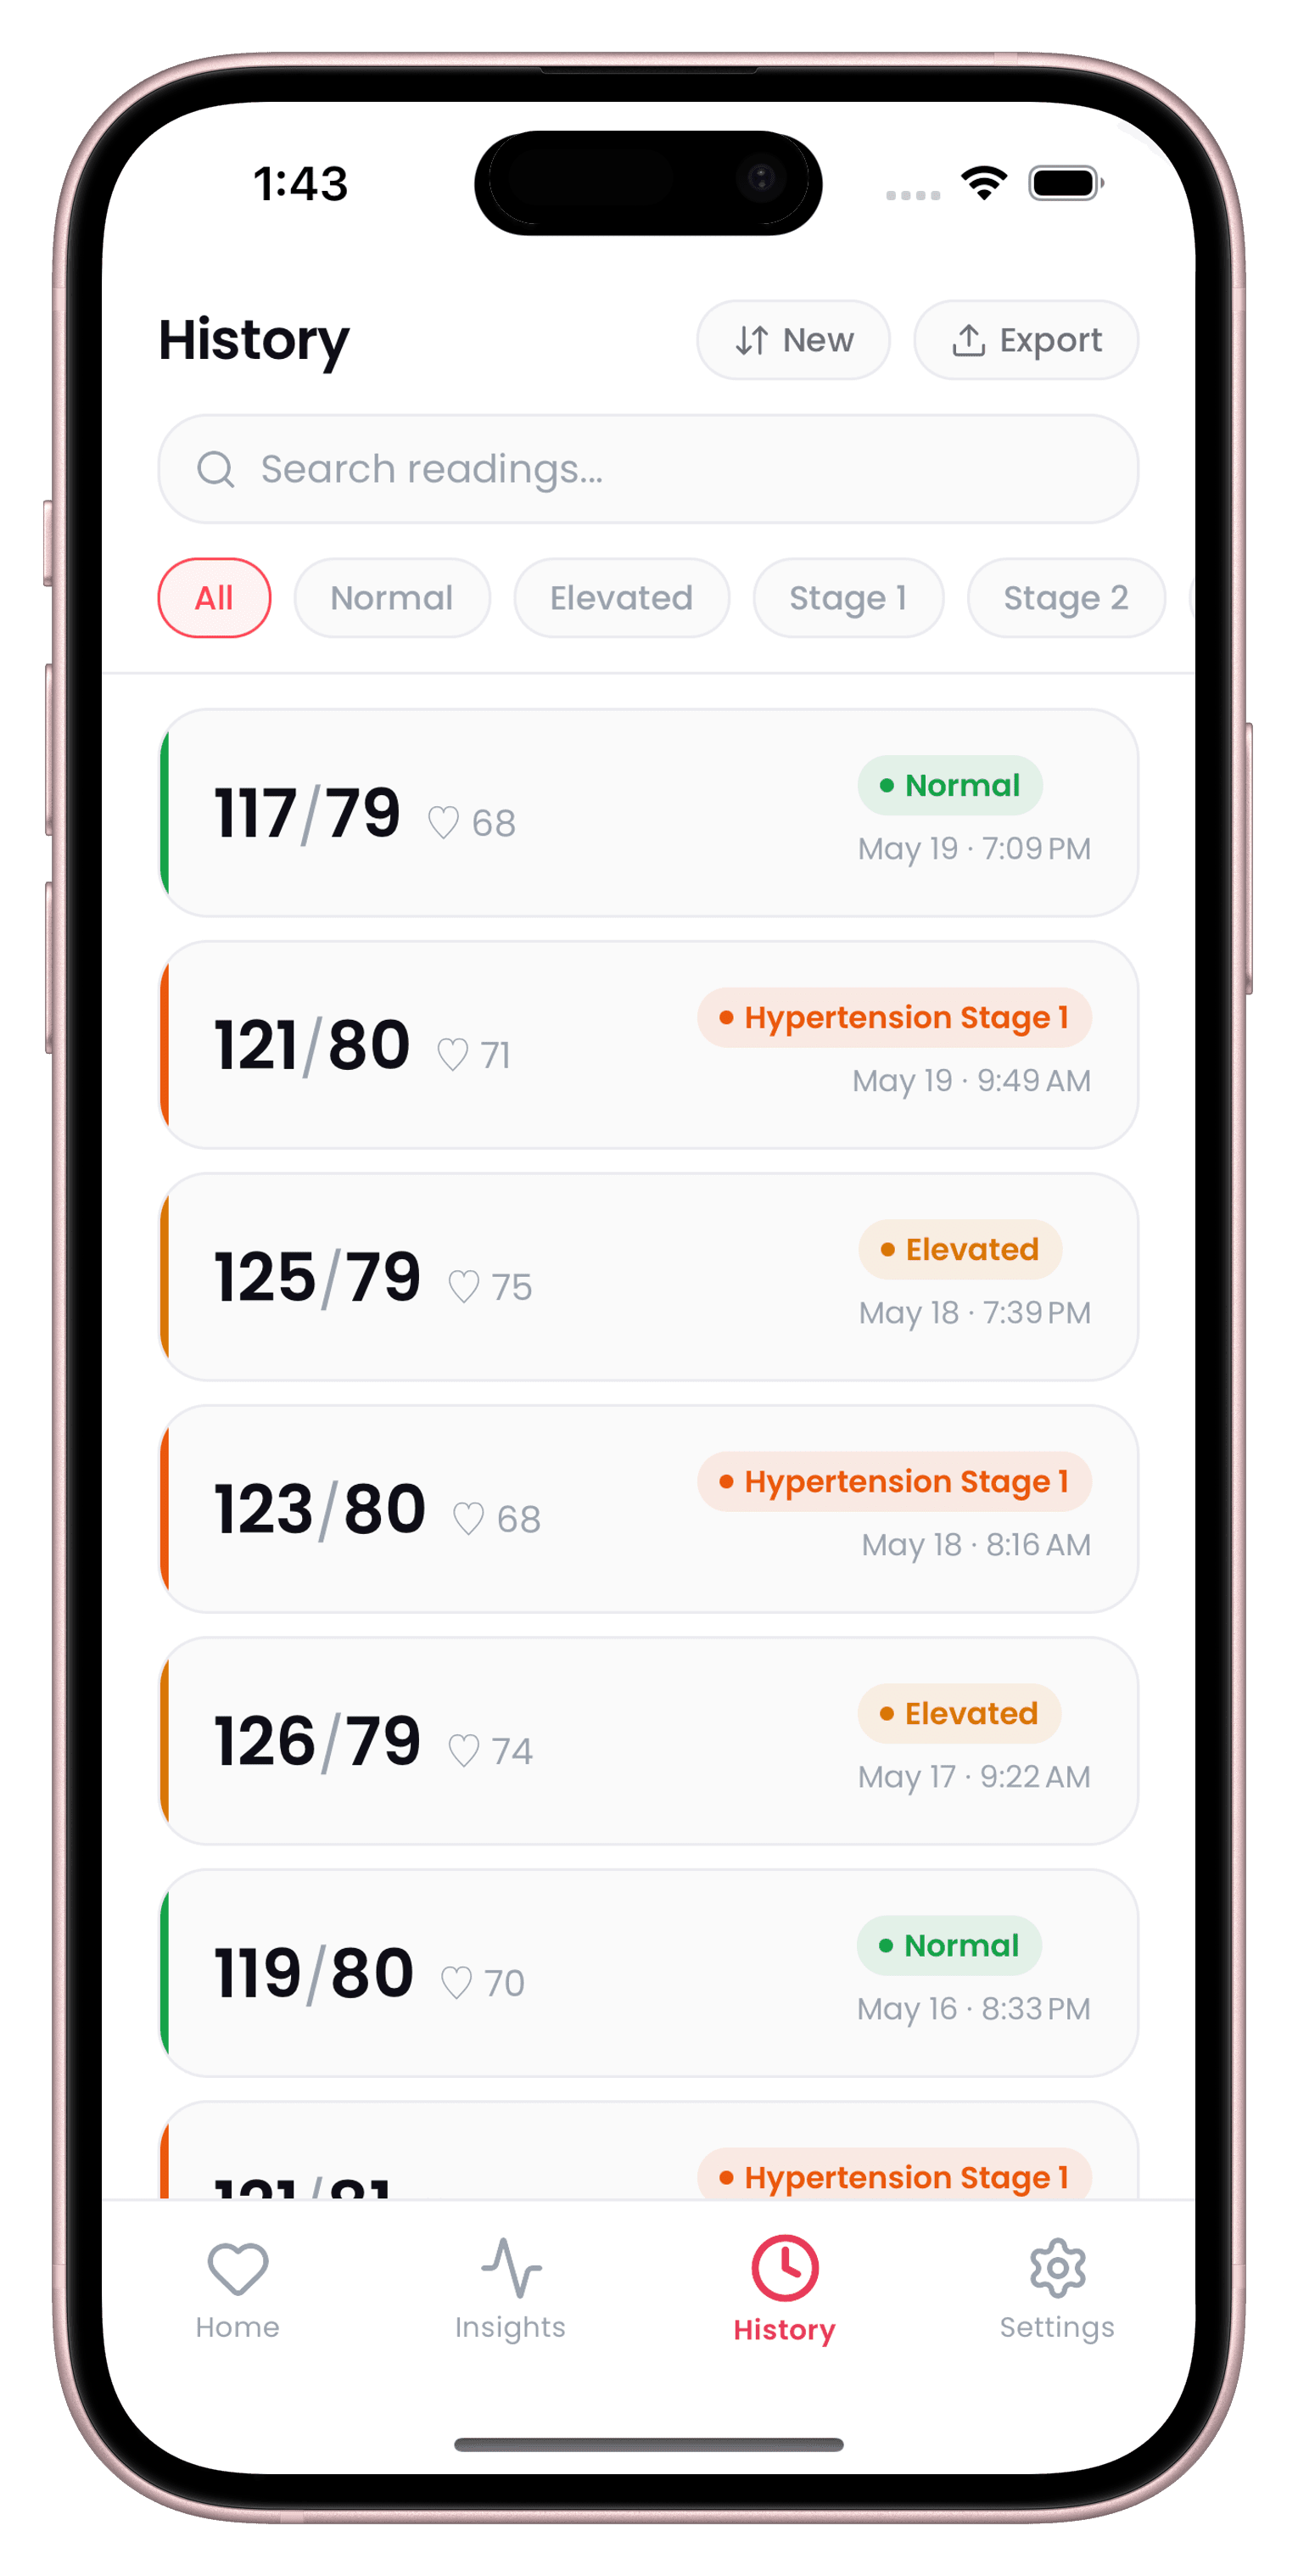
CardiLog stages each reading with the AHA categories, which use the same thresholds at any age, and charts your readings over 7, 30 and 90 days. Its weekly insight is rule-based and runs on your phone. One rule flags a sustained rise, when your systolic is up 5 mmHg or more over the last 14 days compared with the 14 days before.
If you're helping an older relative, see our page on tracking blood pressure for parents. CardiLog allows up to 5 profiles, but readings currently share one history, so a parent's own phone is often the cleaner option.
Sources
- CDC NCHS Data Brief No. 511: Hypertension prevalence, awareness, treatment, and control among adults, 2021–2023
- Franklin SS et al. Hemodynamic patterns of age-related changes in blood pressure: the Framingham Heart Study. Circulation 1997
- Franklin SS et al. Does the relation of blood pressure to coronary heart disease risk change with aging? Circulation 2001
- American Heart Association: Top Things to Know, 2025 High Blood Pressure Guideline
- NICE NG136: Hypertension in adults, diagnosis and management (recommendations)
This guide is general information, not medical advice. CardiLog is not a medical device. Talk to your doctor about your own readings.