

Short answer
Under the AHA/ACC guideline, normal blood pressure is below 120/80 mmHg, elevated is 120–129 systolic with diastolic under 80, stage 1 hypertension is 130–139 systolic or 80–89 diastolic, and stage 2 is 140/90 or higher. A reading above 180/120 is severe, and if it comes with symptoms like chest pain or trouble speaking, call emergency services.
The AHA/ACC blood pressure chart
Most charts you'll find online, and the one CardiLog uses, come from the American Heart Association and American College of Cardiology. The categories were set in 2017, and the 2025 AHA/ACC guideline kept them unchanged.
- Normal: systolic under 120 and diastolic under 80
- Elevated: systolic 120–129 and diastolic under 80
- Stage 1 hypertension: systolic 130–139 or diastolic 80–89
- Stage 2 hypertension: systolic 140 or higher, or diastolic 90 or higher
- Severe hypertension: higher than 180 and/or higher than 120
Notice the "and" in the first two rows and the "or" in the rest. You only need one number in a higher range to move up a category. If your two numbers land in different categories, the higher one wins. So 126/84 is stage 1, not elevated, because the diastolic sits in the 80–89 band.
The chart applies to all adults, whatever their age. There's no separate column for people over 60. We cover that in normal blood pressure by age.
Readings above 180/120
The AHA now calls anything higher than 180 systolic and/or 120 diastolic severe hypertension. Its advice is simple: wait one minute and measure again. If the second reading is still that high and you feel fine, contact your doctor.
It becomes a hypertensive emergency when the high reading comes with symptoms that suggest organ damage. Call 911 (or your local emergency number) if you have any of these:
- Chest pain
- Shortness of breath
- Back pain
- Numbness or weakness
- A change in vision
- Difficulty speaking
Don't wait to see whether the next reading comes down. A severe reading without symptoms is still worth a same-day call to your doctor. The 2025 guideline says it should be treated promptly, typically by starting or adjusting oral medication.
What about low blood pressure?
The AHA/ACC chart doesn't have a low category. The NHS defines low blood pressure (hypotension) as a reading under 90/60 mmHg.
A low number on its own isn't always a problem. Plenty of healthy people sit near 90/60 without symptoms. It matters more when you feel dizzy, light-headed or faint, especially when you stand up, and that's worth raising with a doctor.
How Europe and the UK draw the lines
If you live outside the US, your doctor may be using a different chart. The 2024 European Society of Cardiology (ESC) guideline uses three groups instead of four:
- Non-elevated: under 120/70
- Elevated: systolic 120–139 or diastolic 70–89
- Hypertension: 140/90 or higher
The ESC deliberately avoids the word "normal", because heart risk keeps rising with blood pressure even in the lowest range. It also recommends medication for people with elevated readings of 130/80 or more who are at high cardiovascular risk and haven't come down after about three months of lifestyle changes.
In England, NICE guideline NG136 diagnoses hypertension from a clinic reading of 140/90 or higher, confirmed by home or ambulatory monitoring averaging 135/85 or higher. NICE calls 160/100 in clinic (150/95 at home) stage 2, and 180/120 in clinic severe.
Here's how one reading plays out. A home average of 132/82 is stage 1 hypertension under AHA/ACC, elevated under ESC, and below the NICE home threshold of 135/85. Same numbers, three labels. That's why it's worth asking your doctor which guideline they follow.
One reading isn't a diagnosis
Blood pressure moves all day. Talking, a full bladder, coffee, a brisk walk or a tense meeting can all push a single reading up. Every major guideline bases decisions on an average of readings taken on different occasions, not one number.
The 2025 AHA/ACC guideline puts weight on home monitoring, and it advises against relying on cuffless devices such as smartwatches until they're shown to be accurate. A validated upper-arm cuff, used the same way each time, gives you numbers you can trust. Our guide on taking accurate measurements walks through the steps.
What each stage means for treatment
Treatment is your doctor's call, but it helps to know the general shape of the 2025 AHA/ACC recommendations:
- All stages: lifestyle changes such as less sodium, more potassium, regular activity, a healthy weight, less alcohol and managing stress
- Average of 140/90 or higher: medication plus lifestyle changes
- Average of 130/80 or higher with heart disease, a previous stroke, diabetes, kidney disease or a 10-year risk of 7.5% or more: medication plus lifestyle changes
- Average of 130/80 or higher at lower risk: medication if the average is still 130/80 or more after 3–6 months of lifestyle changes
For most adults, the treatment goal is an average under 130/80.
How CardiLog uses this chart
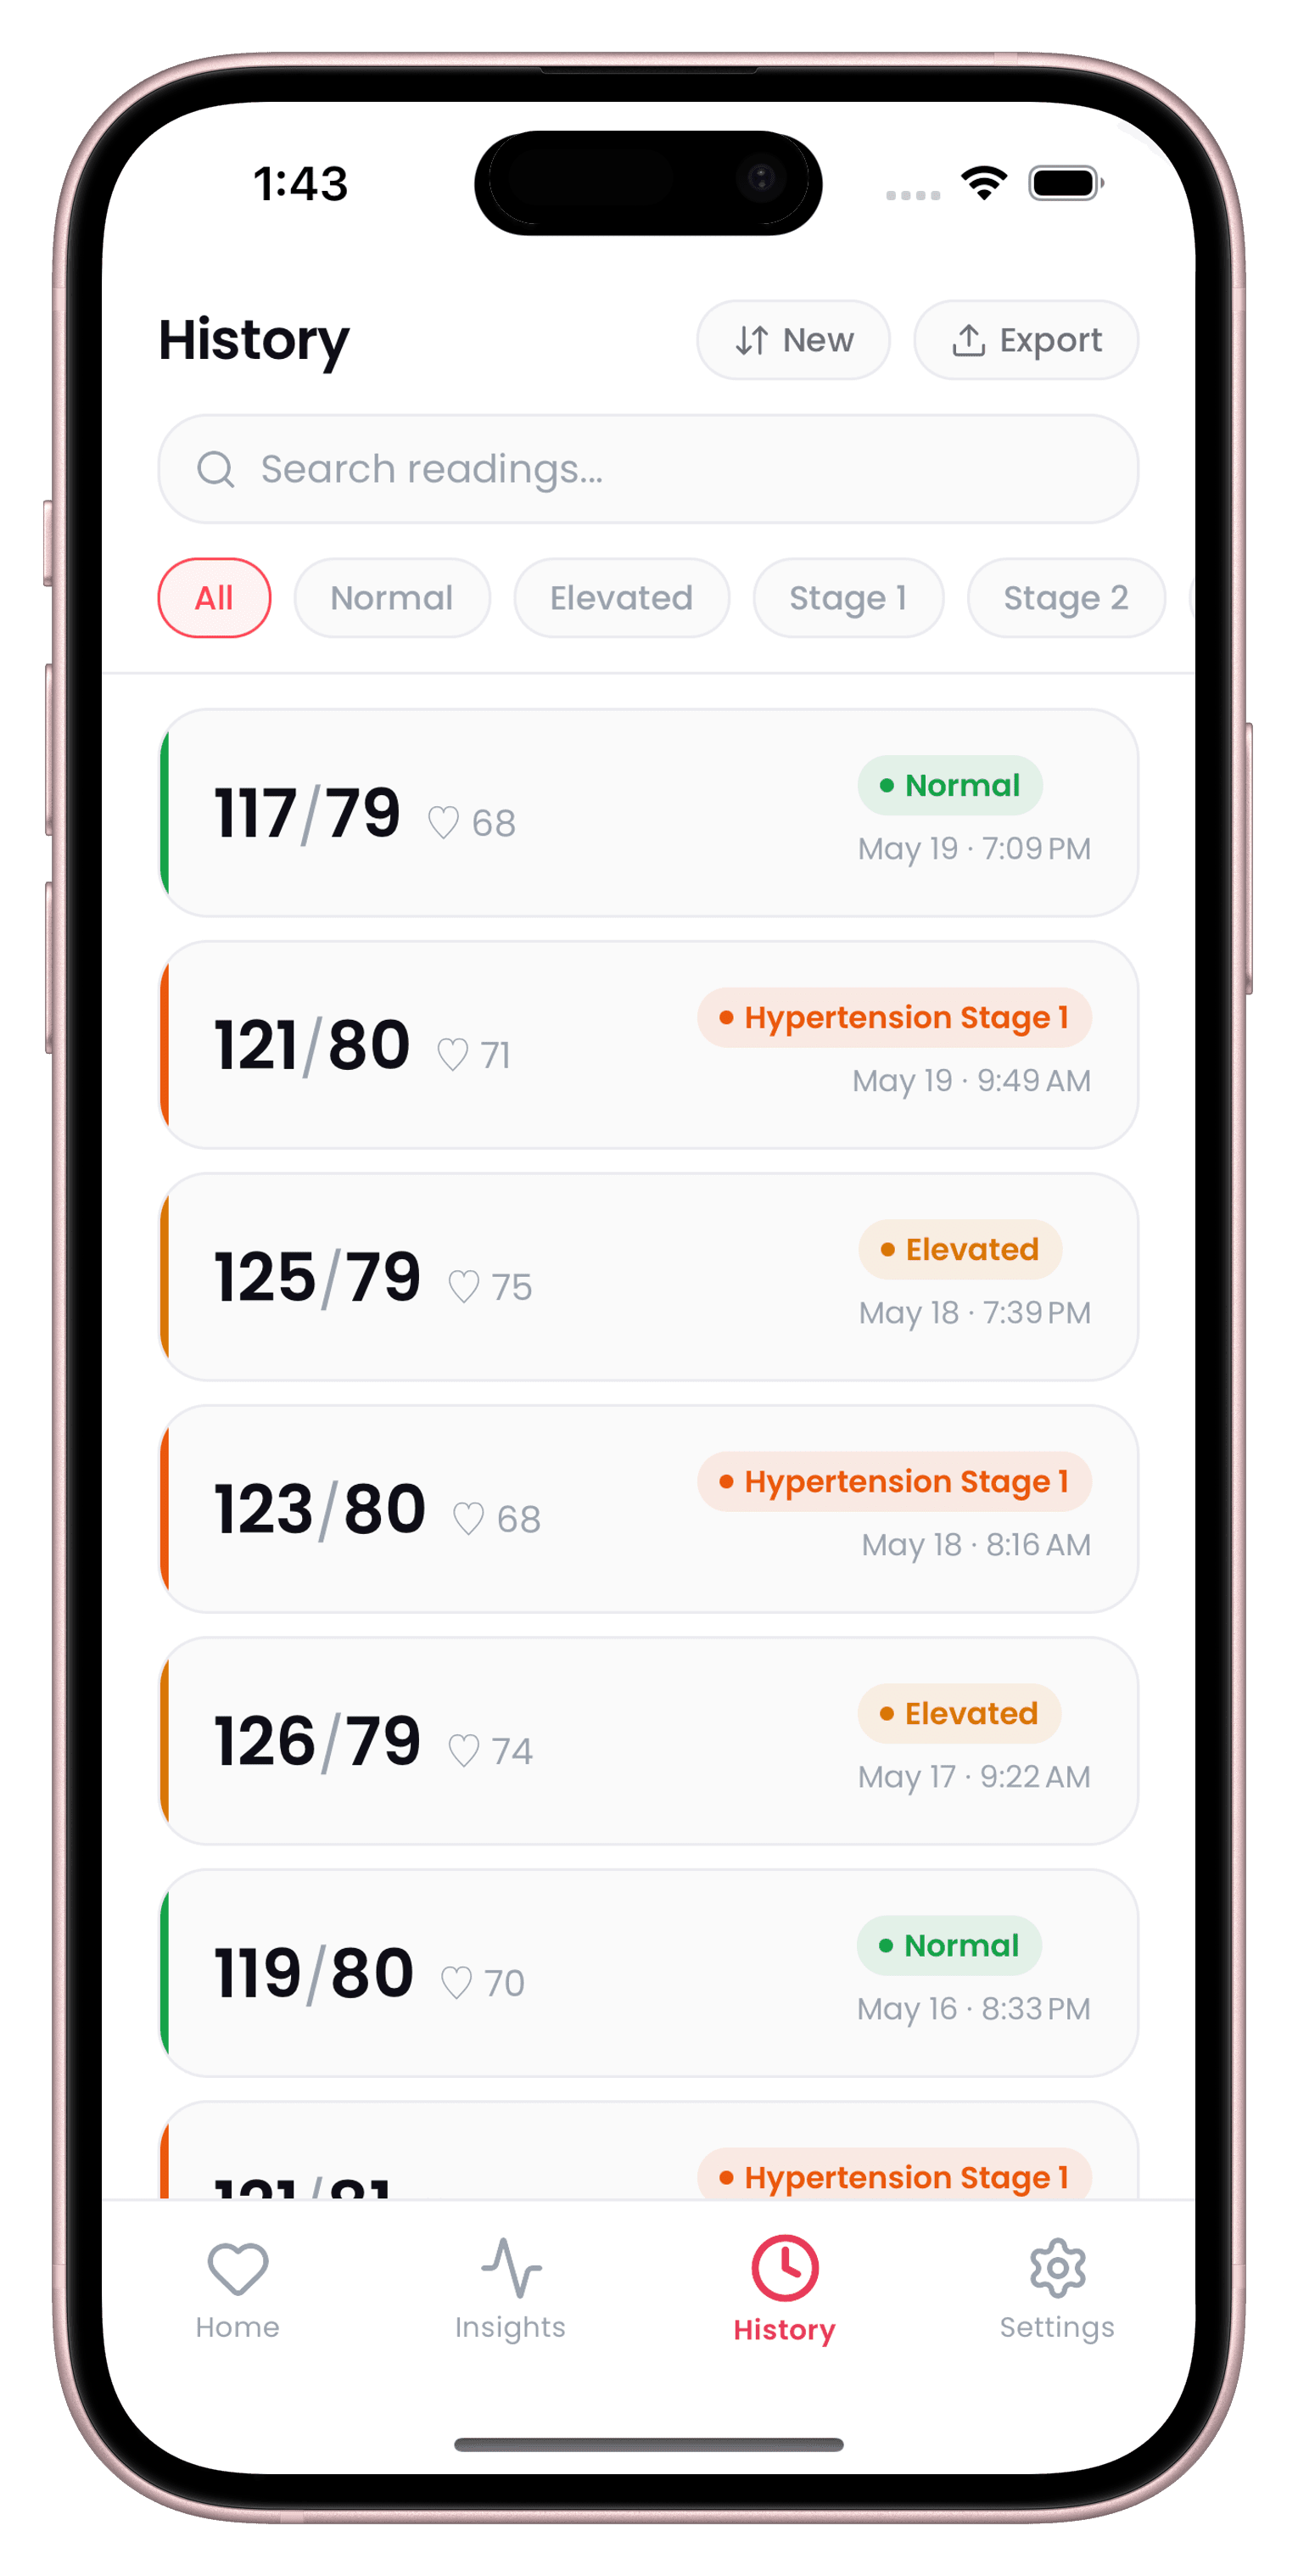
CardiLog stages each reading against the AHA 2017 categories as soon as you log it: Normal, Elevated, Stage 1 (130/80 and up), Stage 2 (140/90 and up), Crisis (180/120 and up) and Low (under 90/60). Each reading shows a color-coded badge in your history, and a crisis-level reading opens an emergency screen.
The app has a guideline setting, but for now readings are always staged with AHA. If your doctor works with ESC or NICE thresholds, use the comparison above to translate.
Your stage also appears in the PDF report you can share with your doctor, next to your averages, mean arterial pressure and pulse pressure. CardiLog is a logbook, not a medical device, so use it to bring better data to the appointment rather than to diagnose yourself.
Sources
- American Heart Association: Understanding Blood Pressure Readings
- American Heart Association: Top Things to Know, 2025 High Blood Pressure Guideline
- McEvoy JW et al. 2024 ESC Guidelines for the management of elevated blood pressure and hypertension. Eur Heart J (PubMed)
- NICE NG136: Hypertension in adults, diagnosis and management (recommendations)
- NHS: Low blood pressure (hypotension)
This guide is general information, not medical advice. CardiLog is not a medical device. Talk to your doctor about your own readings.