
AI Insights & Trend Detection
A single reading only tells you where you are right now. CardiLog's weekly AI analysis looks at your full history to catch the patterns a snapshot view can't — before they become a crisis.

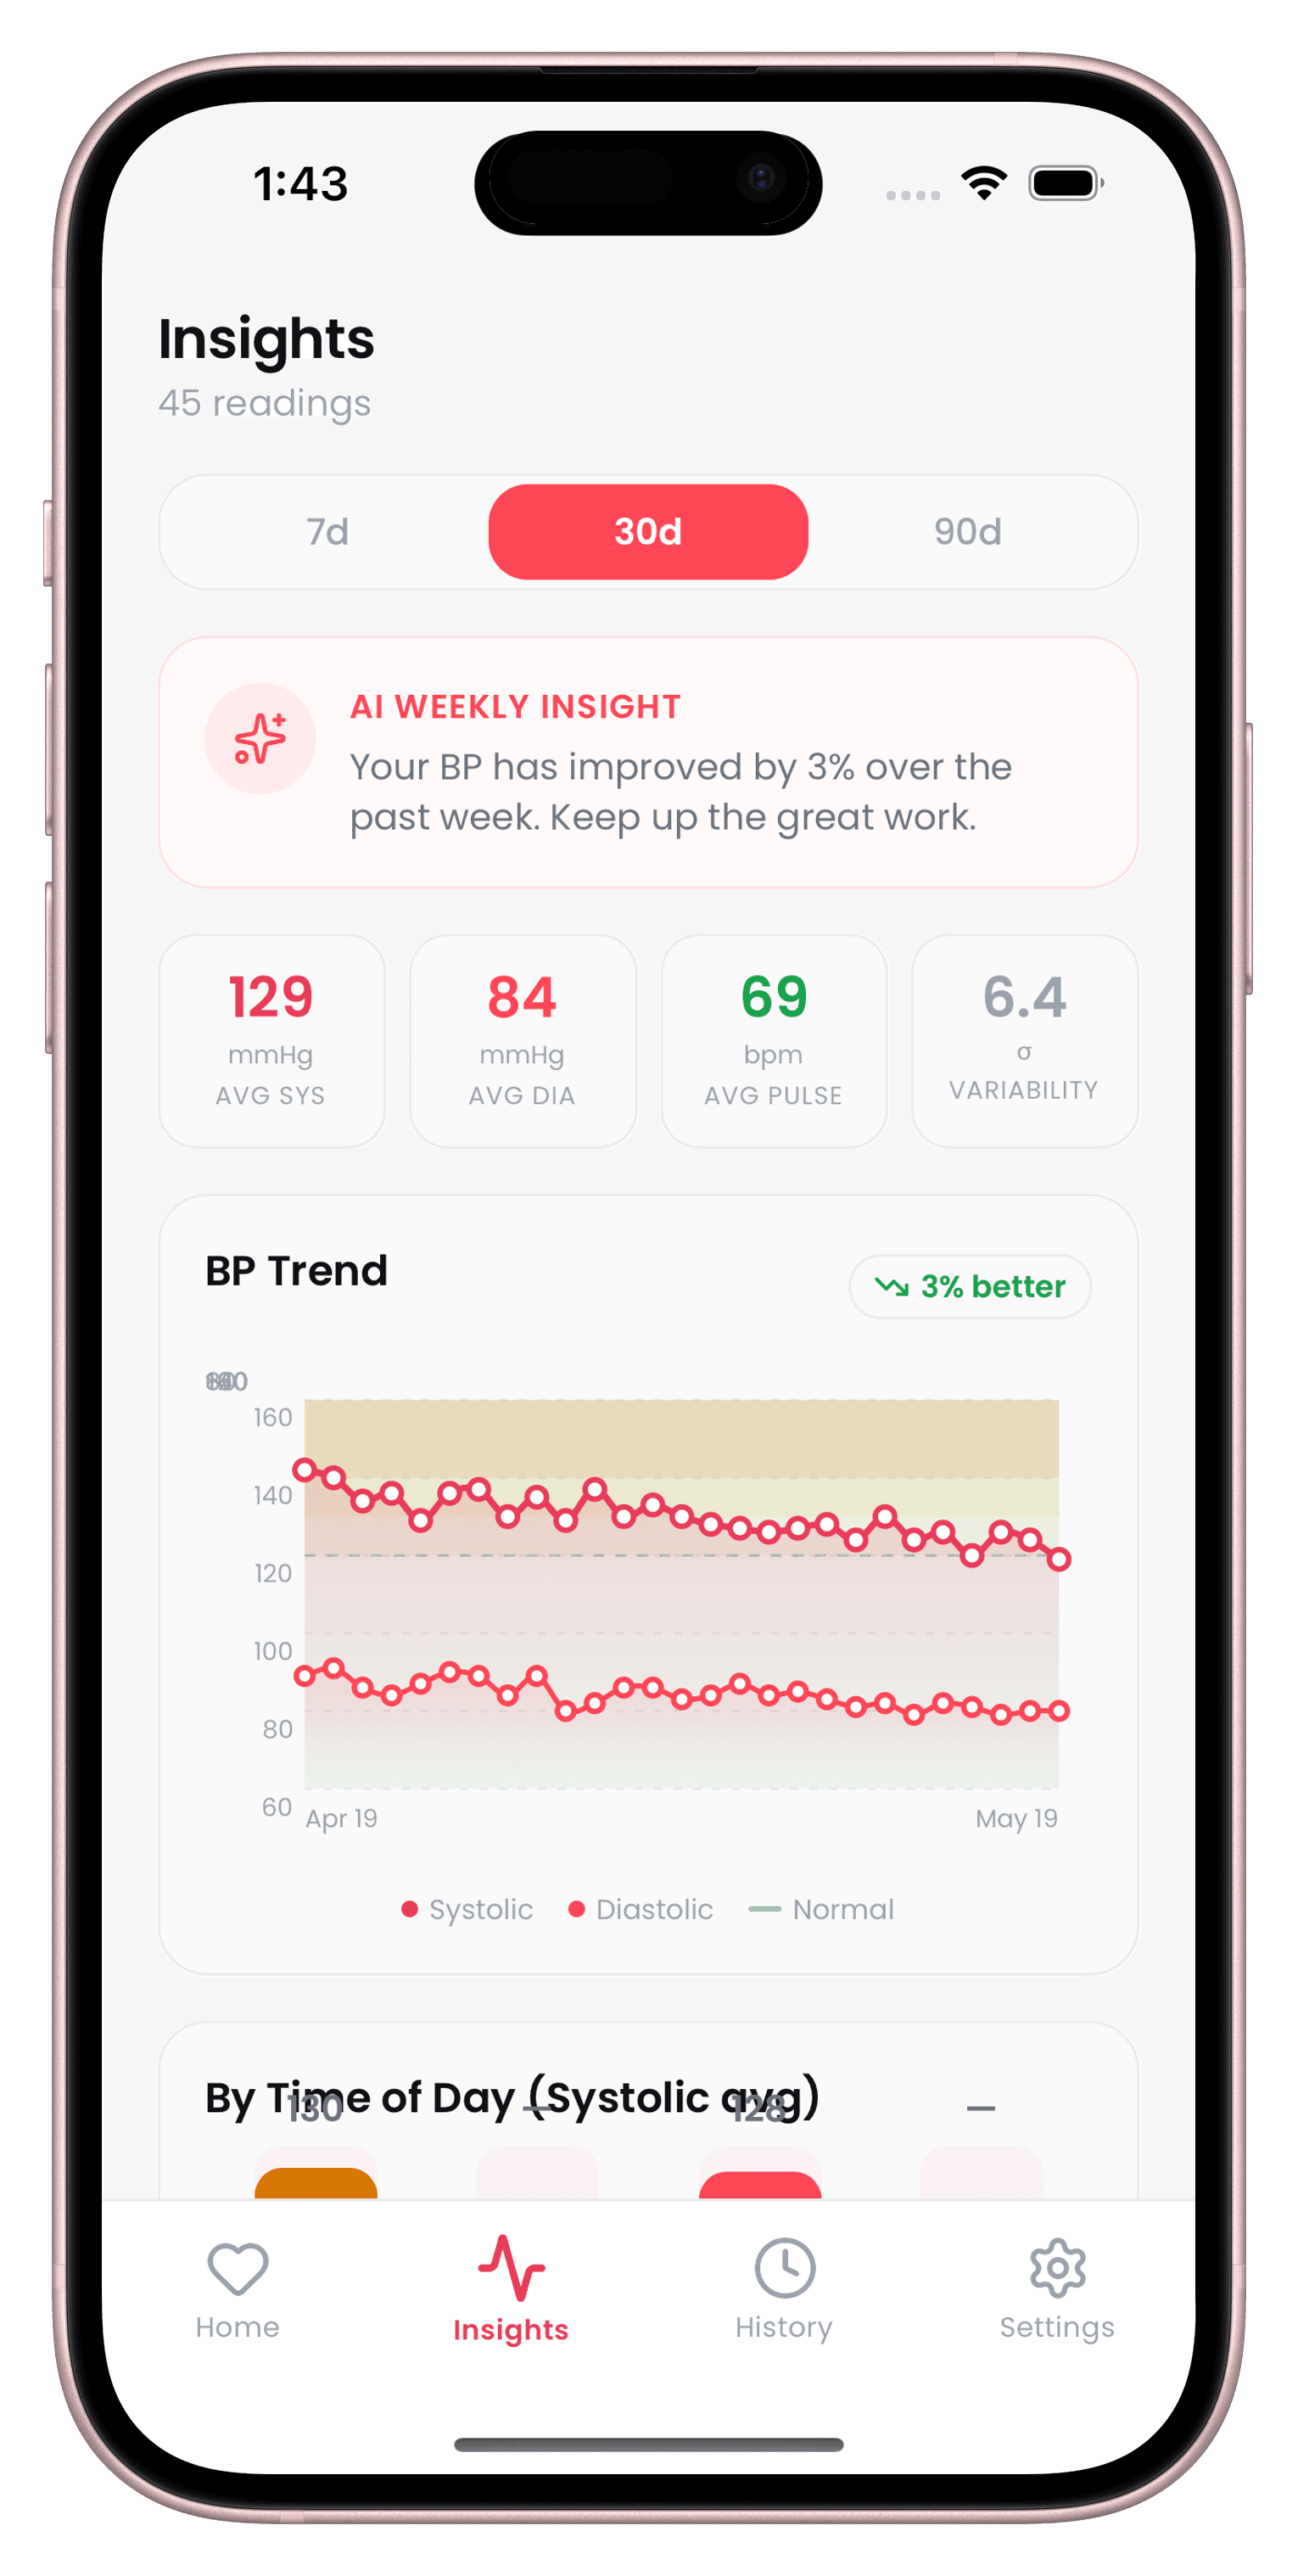
What AI Insights gives you
Weekly AI insight
A short, automatically generated summary of how your numbers moved this week and what's worth paying attention to.
Morning Surge detection
Flags dangerous early-morning BP spikes, a known risk factor for stroke and heart attack.
White Coat Effect detection
Flags when your clinic readings consistently run higher than your home baseline, so you get a more accurate picture.
7, 30, and 90-day trend charts
See systolic, diastolic, average pulse, and reading-to-reading variability charted over any time window, with a normal range band for context.
AI Insights & Trend Detection — FAQ
How does CardiLog's AI trend detection work?
Each week, CardiLog analyzes your recent history — not just your latest reading — to surface patterns like rising trends, unusual variability, or time-of-day spikes.
What is a time-of-day breakdown?
It's a chart of your average systolic reading grouped into morning, afternoon, evening, and night, so you can spot which part of your day runs highest.
Start tracking today.
Your doctor checks your BP twice a year. CardiLog watches it every day.
Free to start · No account required